

July 16, 2023 (MLN): The following is an outlook for the KSE-100 index and some strong scrips based on technical analysis (historical quantitative data).
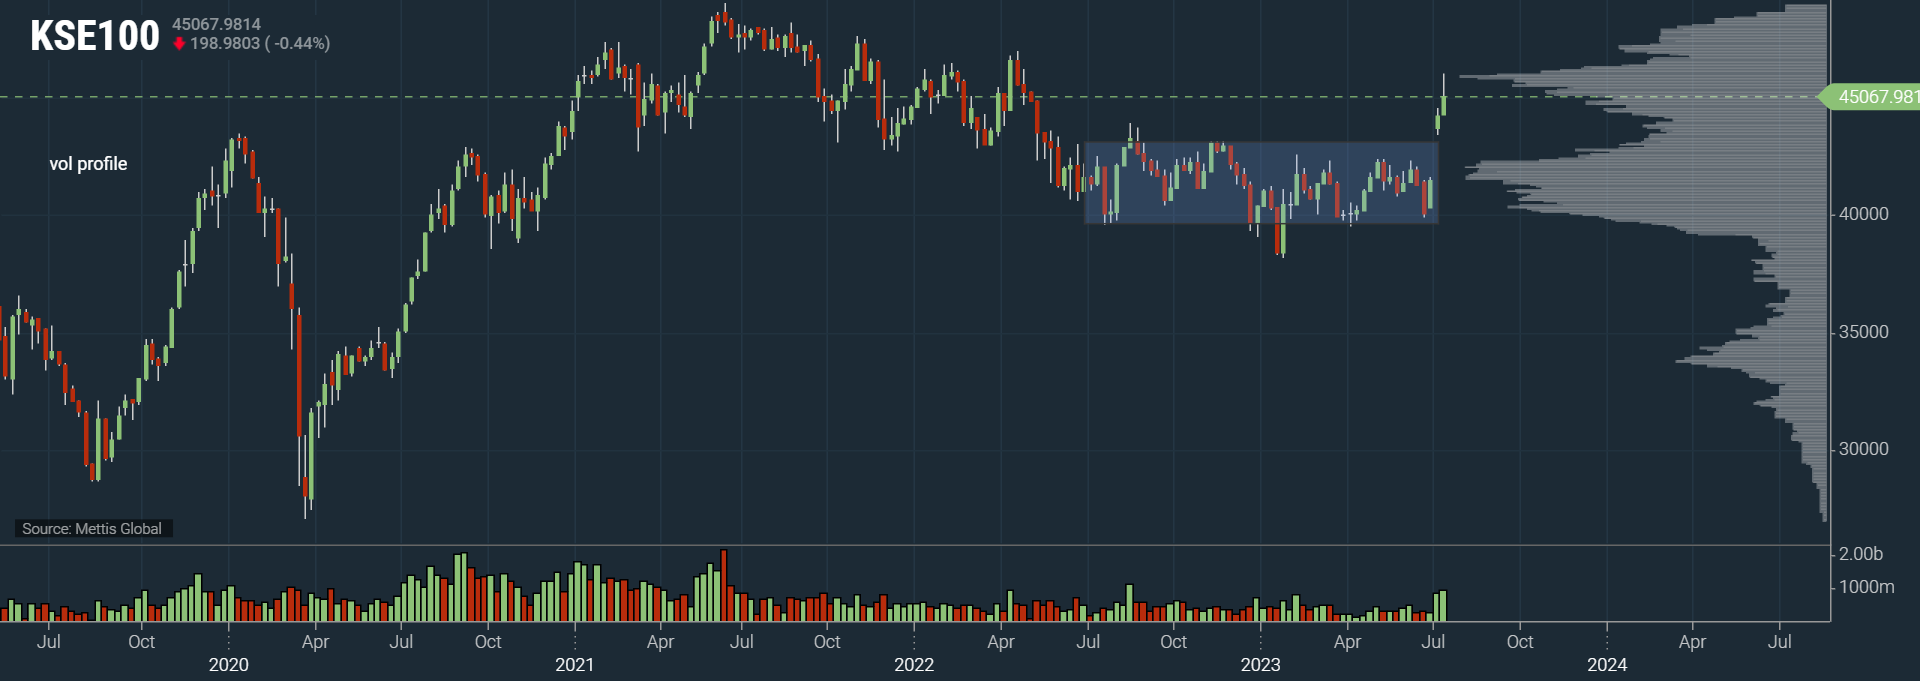
KSE-100 Weekly time-frame chart
KSE-100 Daily time-frame chart
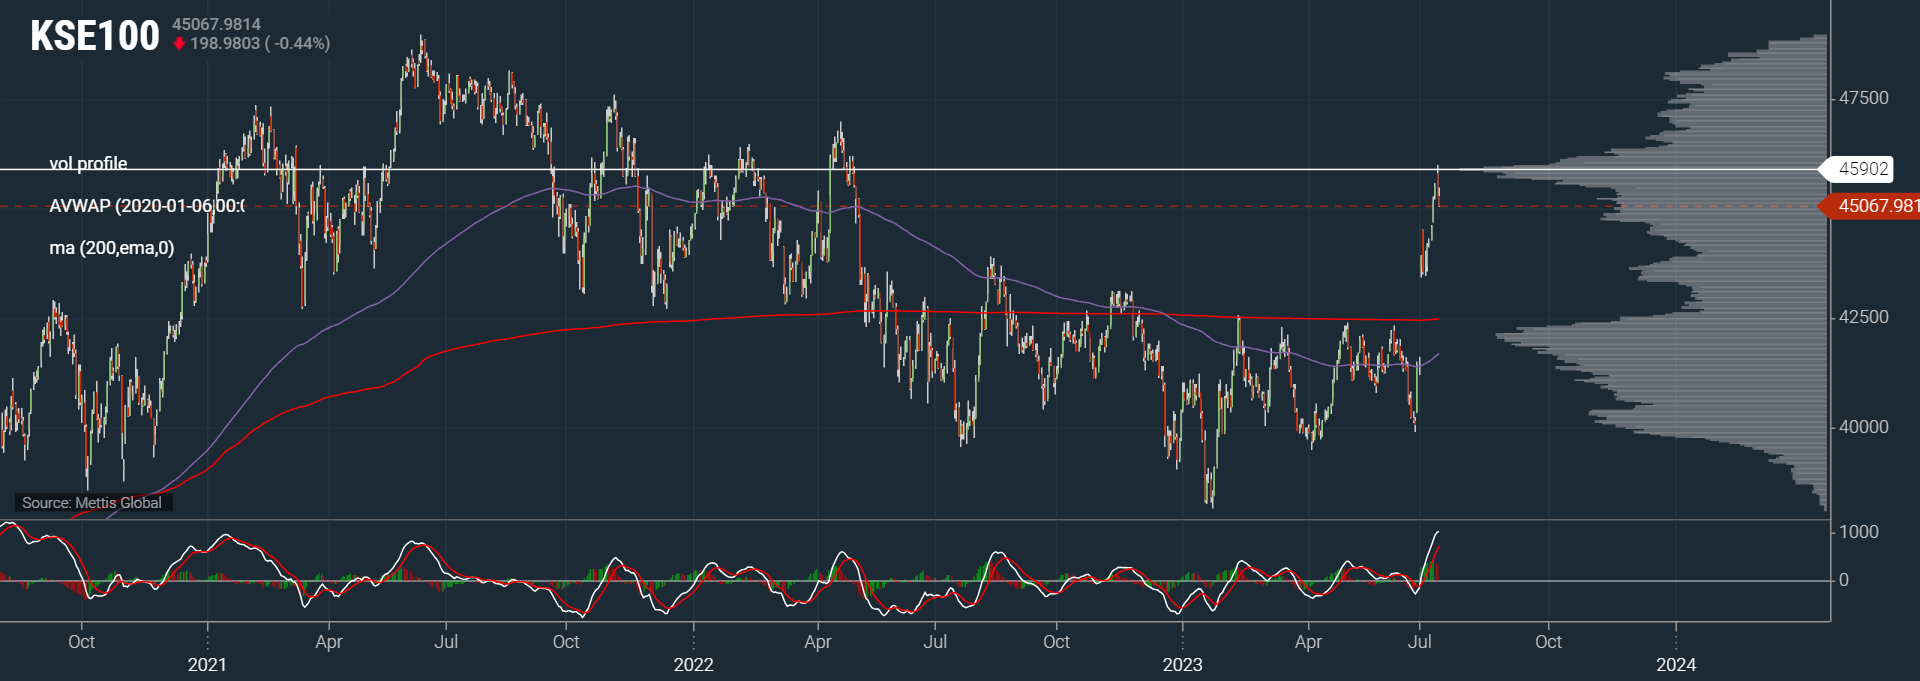
| Support Levels | ||
|---|---|---|
| 45,000 | 44,200 | 43,200 |
| S1 | S2 | S3 |
| Resistance Levels | ||
|---|---|---|
| 45,400 | 45,900 | 47,300 |
| R1 | R2 | R3 |
The benchmark KSE-100 Index closed Friday's trading session at 45,067 points.
The index saw profit-taking for the second consecutive day to end the trading week.
It closed down 1.96% from the high, as it continued to consolidate after an intense rally for the past two weeks.
In case of a major correction, the 43,200pts area will serve as very strong support, as this was the range-high of the 12-month range it broke out of two weeks ago (39,800 – 43,200pts).
Stop losses are recommended on acceptance back inside the range (range: 39,800 – 43,200pts), which would indicate deviation of the range.
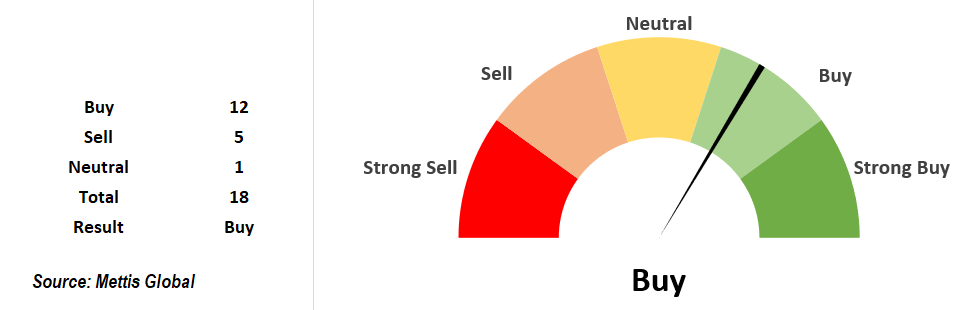
Short-term technical indicators are giving a buy stance. Additionally, the Moving Average Convergence Divergence (MACD) is bullish as it is trading above its signal line. The MACD crossed above its signal line ten trading sessions ago. Since the MACD crossed its moving average, the Index has increased by 3.17%.
Strong Scrips
| Ticker | Close Price | Resistance | Upside target on Breakout | Short-term trend | Longterm trend | MA Stance | Oscillator Stance | |
| Short-term | Long-term | |||||||
| SEARL | 47.6 | 50 | 58.5 | 69.65 | Up | Down | Buy | Neutral |
| PSO | 121.64 | 126 | 154 | 200 | Up | Down | Buy | Sell |
| HCAR | 124.27 | 129 | 136 | 165 | Up | Down | Strong Buy | Sell |
| OGDC | 85.3 | 88.25 | 99 | 125 | Up | Down | Strong Buy | Neutral |
| WTL | 1.29 | 1.35-1.4 | 1.6 | 1.95 | Neutral | Down | Strong Buy | Neutral |
Price per share (Rs)
| Unusual Volume (PKR) | |||
|---|---|---|---|
| Ticker | MTD Average | 52 week Average | Volume Change |
| SEARL | 167,249,805 | 69,048,688 | 2.42x |
| PSO | 459,050,342 | 149,166,906 | 3.08x |
| HCAR | 57,853,928 | 19,837,086 | 2.92x |
| OGDC | 656,060,417 | 319,901,760 | 2.05x |
Month-to-date (MTD)
SEARL
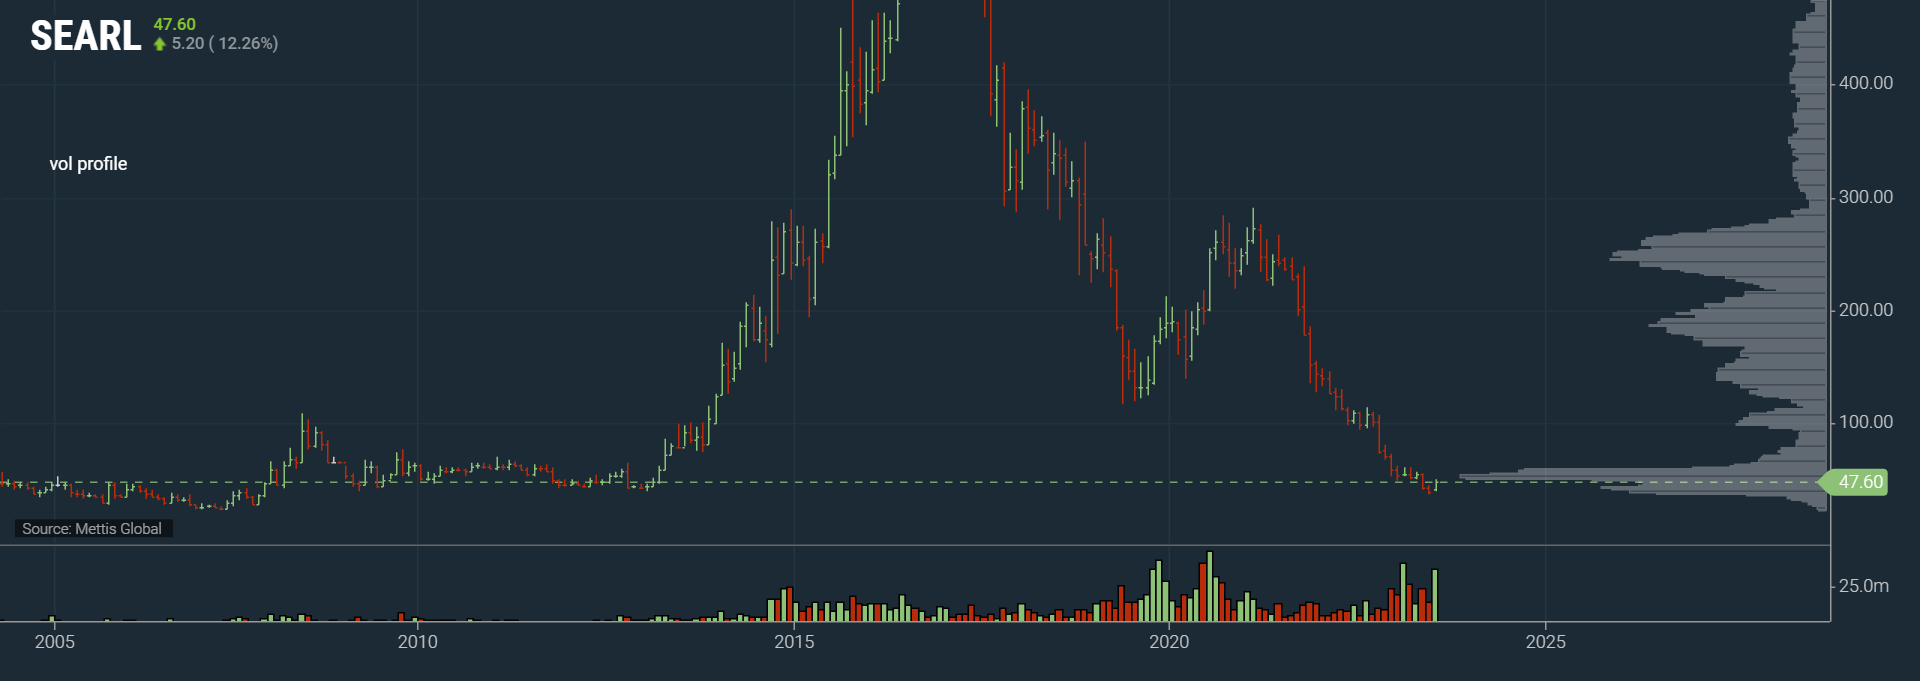
Weekly time-frame chart
SEARL is trading around long term support area, which is also around the major high volume node (HVN), in the past few days it has seen record high volumes, consequently SEARL looks ready to breakout to fill the gap to atleast 1D 200 EMA, which is around Rs58.4. The uptrend will be intact unless it trades below Rs43.46.
PSO
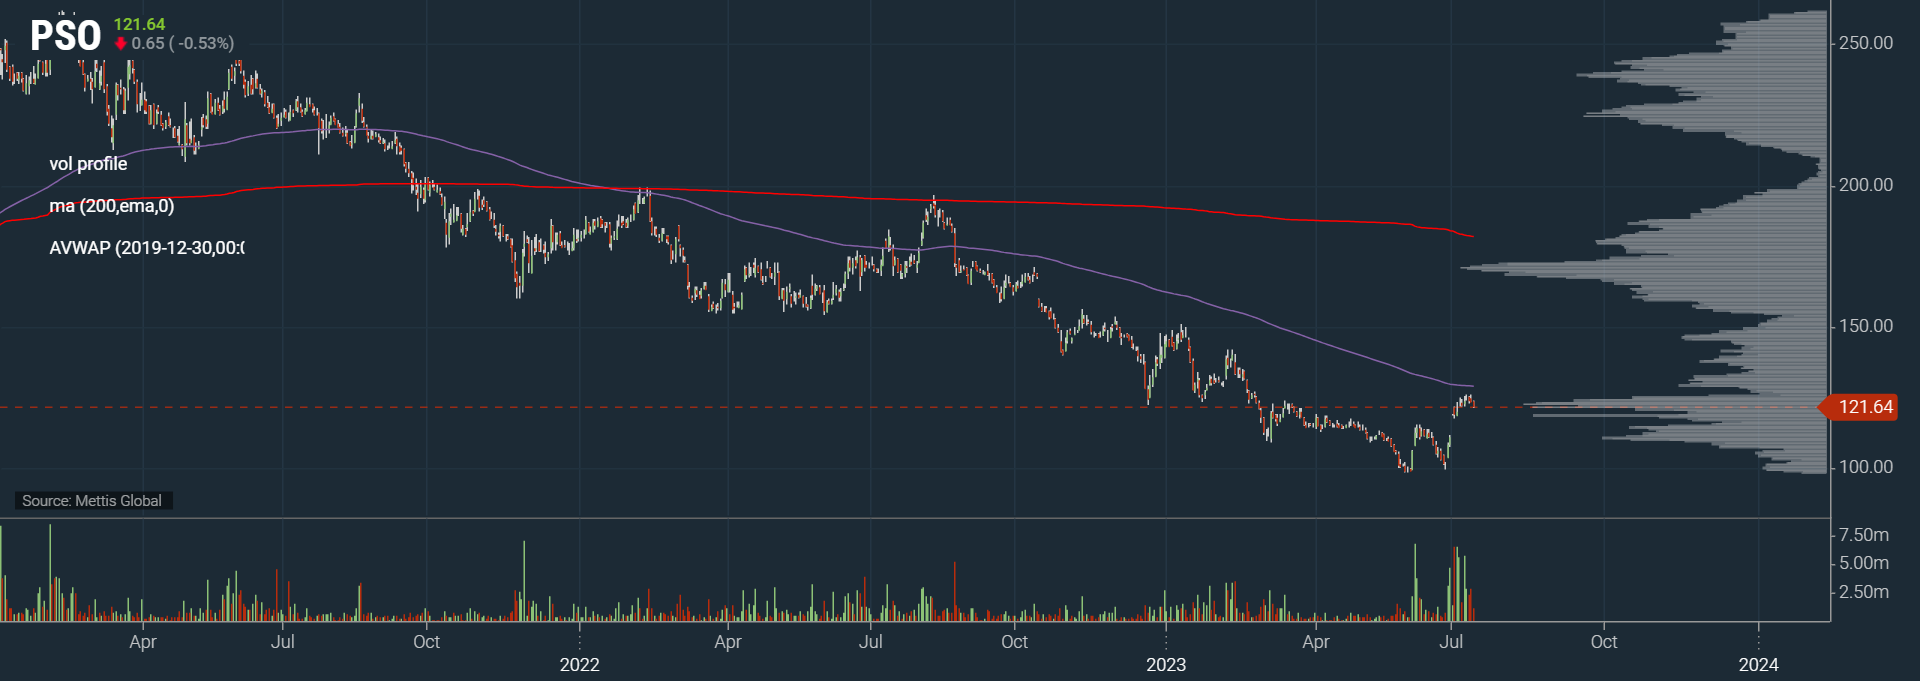
Daily time-frame chart
PSO is one of the large cap scrips that fell towards its short-term support area, unless it starts to find acceptance below Rs114 area, uptrend will be intact for another leg up.
HCAR
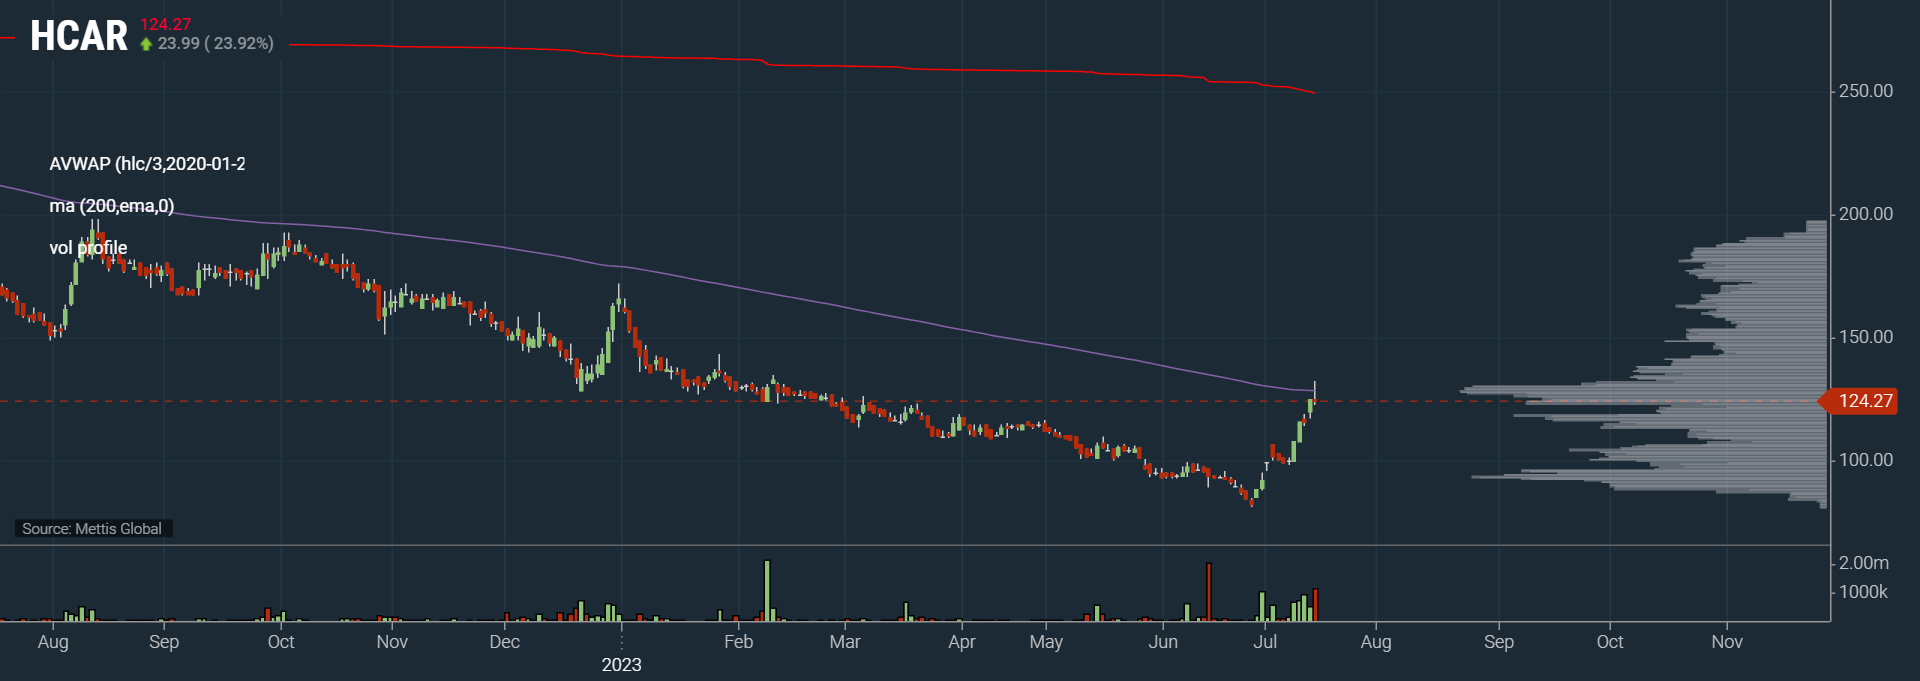
Daily time-frame chart
HCAR is consolidating right below 1D 200EMA level, a breakout above this will provide a lot of room for upside as there has not been much trading activity between these levels in the past. Additionally, HCAR has never traded above its 1D 200EMA since September of 2021. HVN is around Rs175, whereas VWAP is way above this price. With volumes picking as well, it should provide some mean reversion even though it might be unlikely to trade near HVN or VWAP.
OGDC
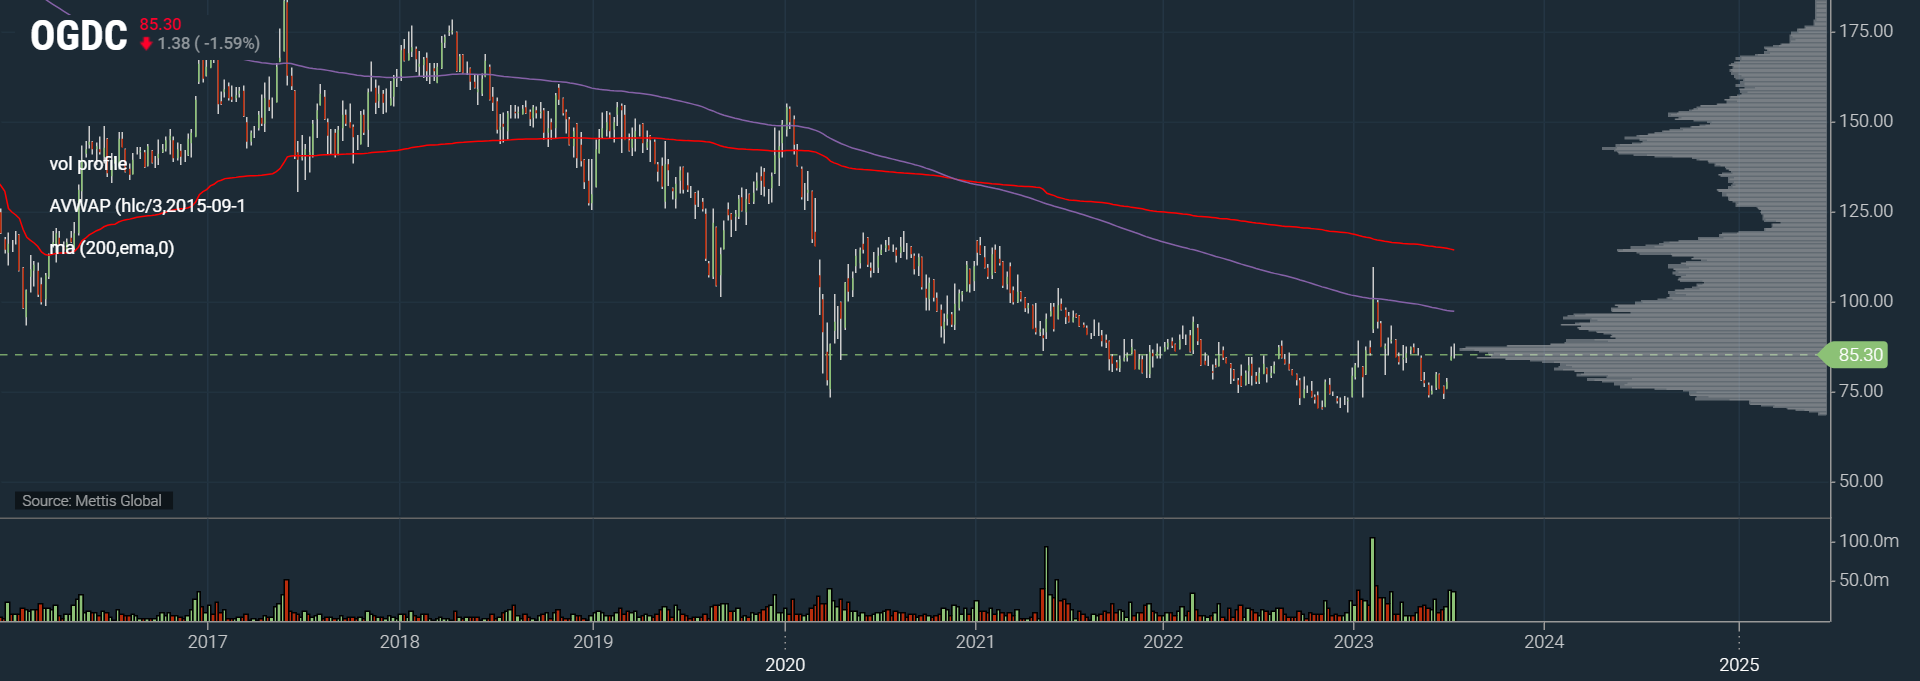
Weekly time-frame chart
The current indecision in prices does not offer a high risk:reward opportunity for OGDC. Therefore, the following two scenarios are recommended if looking to build a position:
- If the market experiences a deeper correction, OGDC might fall into the strong support zone of Rs79.7-81.5. This area is a good buying zone as it has flipped 1D 200EMA.
- Buying above a breakout of Rs88.
WTL
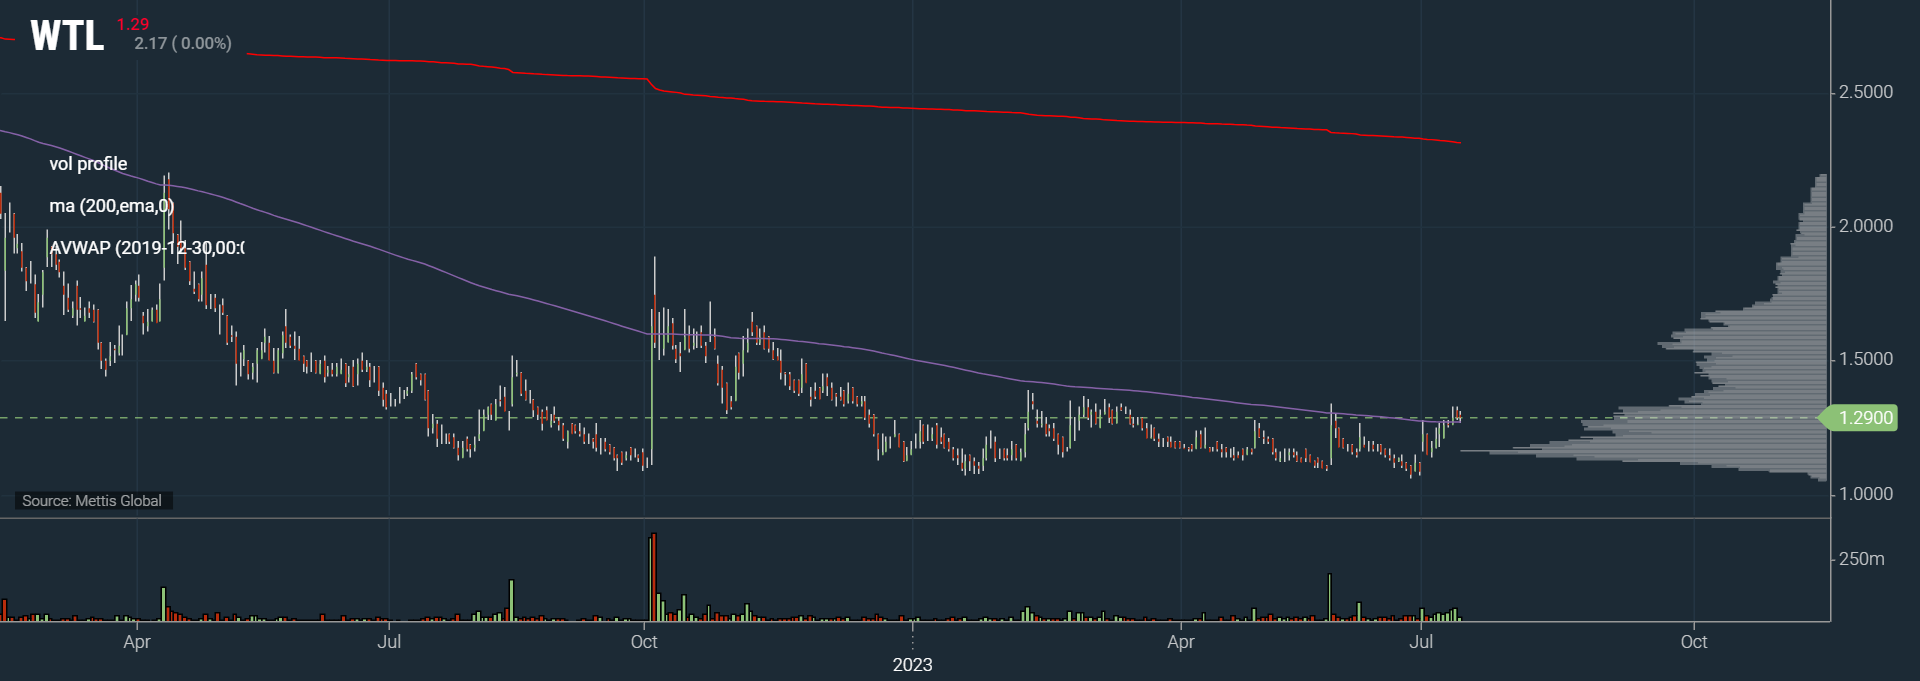
Daily time-frame chart
The market's current state/environment can be gauged by observing the performance of high-risk stocks (like WTL) experiencing significant gains.
This is because, in an optimal risk-on environment, investors are more inclined to invest in riskier assets.
Usually, these stocks start to gain momentum when the market is in the last/final stages of its rally.
WTL is trading around its long-term support and consolidating right around 1D 200EMA, with a limited maximum drawdown, this might be a good play for a breakout.
Technical terms used:
Moving average (MA): A calculation that takes the arithmetic mean of a given set of prices over a specific number of days in the past.
Exponential moving average (EMA): A weighted average that gives greater importance to the price of a stock in more recent days, making it an indicator that is more responsive to new information.
Hull Moving Average (HMA): It measures the average price of an asset over a period of time.
Volume weighted average price (VWAP): It is just a moving average but puts Volume into the calculation.
Point of control (POC): It is the price level at which the greatest number of contracts are traded during a given trading period.
Relative strength index (RSI): It compares a security’s strength on days when prices go up to its strength on days when prices go down.
Moving Average Convergence Divergence: It is a trend-following momemtum indicator that shows the relationship between two EMAs of a security's price. The MACD line is calculated by subtracting the 26-period EMA from the 12-period EMA.
High Volume Node (HVN): It refers to the price at which the largest amount of volume occurred.
Disclaimer: The opinions in this article are the author’s and do not necessarily represent the views of Mettis Link News (MLN).
Copyright Mettis Link News
Posted on:2023-07-16T14:02:04+05:00
39203

