

July 23, 2023 (MLN): The following is an outlook for the Crude Oil based on technical analysis (historical quantitative data).
West Texas Intermediate (WTI) Daily time-frame chart
| Support Levels | ||
|---|---|---|
| $75.92 | $74.12 | $73.69 |
| S1 | S2 | S3 |
| Resistance Levels | ||
|---|---|---|
| $77.39 | $78.03 | $80.09 |
| R1 | R2 | R3 |
Oil prices recorded fourth consecutive weekly gain, driven by increasing concerns of supply shortages in the coming months on top of rising tensions between Russia and Ukraine.
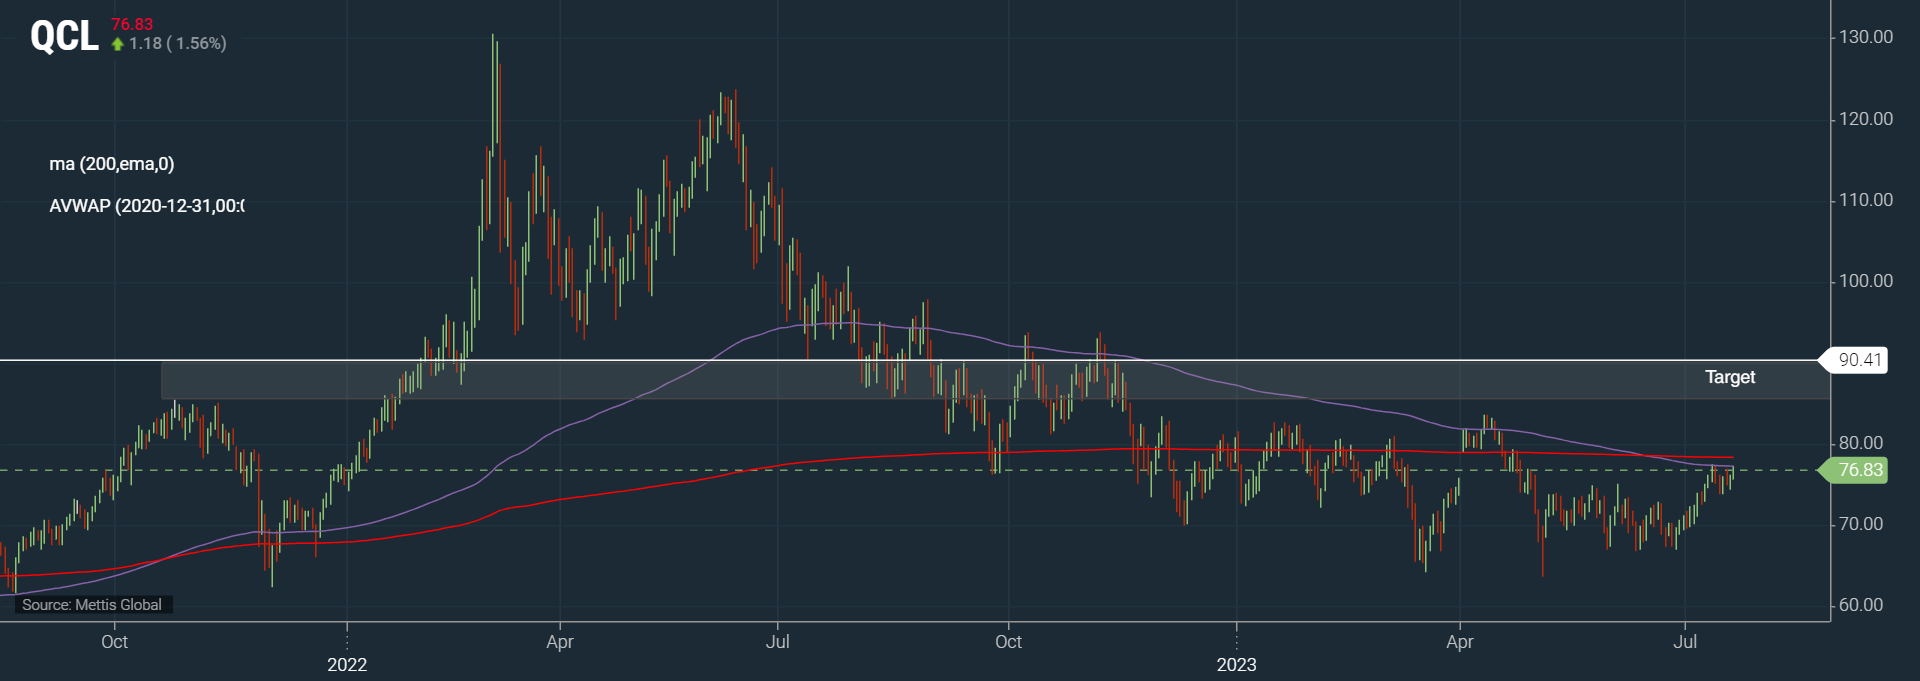
Crude oil futures closed the week at $77.07, up by 2.19% in the week, 9.1% month-to-date, while narrowing year-to-date decline to just 3.97%.
It closed the week right below 1D 200EMA, and has not traded (for continued period) above it since July of 2022.
With technicals giving a buy stance, on top of below mentioned fundamentals, this looks ready to breakout to the upside towards $88-90 area.
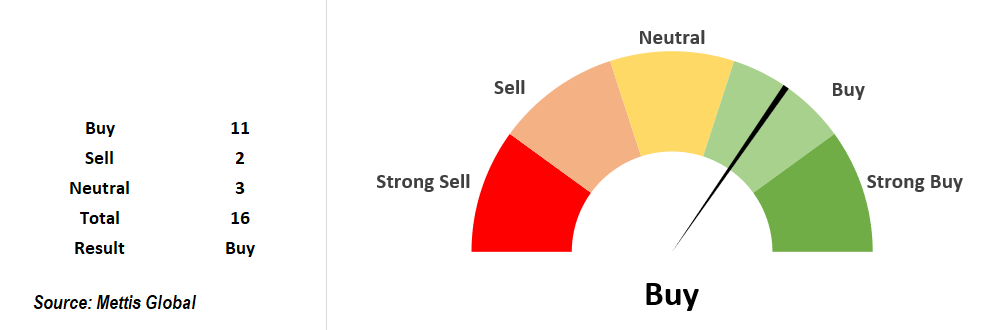
| Indicator | Value | Stance |
|---|---|---|
| Exponential Moving Average (10) | 75.08 | Buy |
| Simple Moving Average (10) | 75.37 | Buy |
| Exponential Moving Average (20) | 73.81 | Buy |
| Simple Moving Average (20) | 72.86 | Buy |
| Exponential Moving Average (30) | 73.21 | Buy |
| Simple Moving Average (30) | 71.98 | Buy |
| Exponential Moving Average (50) | 73 | Buy |
| Simple Moving Average (50) | 71.82 | Buy |
| Exponential Moving Average (100) | 74.12 | Buy |
| Simple Moving Average (100) | 73.69 | Buy |
| Exponential Moving Average (200) | 77.39 | Sell |
| Relative Strength Index (14) | 62.12 | Neutral |
| Stochastic %K (14, 3, 3) | 83.59 | Neutral |
| Momentum (10) | 3.21 | Sell |
| MACD Level (12, 26) | 1.38 | Buy |
| Ultimate Oscillator (7, 14, 28) | 53.52 | Neutral |
Fundamentals
As the U.S. Fed approaches its most rapid series of rate hikes ever, with the markets already pricing in the remaining rate hikes. This creates an opportunity for oil prices to go up, since oil and interest rates tend to move in opposite directions, as stable / lower interest rates encourage economic activity.
Moreover, in the U.S., crude inventories fell last week, adding to concerns of supply tightness, according to latest weekly petroleum status Report by Energy Information Administration (EIA).
U.S. crude oil refinery inputs averaged 16.6 million barrels per day during the week ending July 14, 2023, which was 75,000 barrels per day less than the previous week’s average.
Refineries operated at 94.3% of their operable capacity last week.
Gasoline production decreased last week, averaging 9.5 million barrels per day.
Distillate fuel production decreased last week, averaging 5.0 million barrels per day.
U.S. commercial crude oil inventories (excluding those in the Strategic Petroleum Reserve) decreased by 0.7 million barrels from the previous week.
At 457.4 million barrels, U.S. crude oil inventories are approximately 1% above the five year average for this time of year.
Total motor gasoline inventories decreased by 1.1 million barrels from last week and are about 7% below the five year average for this time of year.
Finished gasoline inventories decreased, while blending components inventories increased last week.
This indicates a supply shortage in the market. The data also shows that gasoline and distillate fuel production and inventories are decreasing, which implies a higher demand for oil products. These factors would likely continue to contribute to the rise in oil prices.
Technical terms used:
Moving average (MA): A calculation that takes the arithmetic mean of a given set of prices over a specific number of days in the past.
Exponential moving average (EMA): A weighted average that gives greater importance to the price of a stock in more recent days, making it an indicator that is more responsive to new information.
Hull Moving Average (HMA): It measures the average price of an asset over a period of time.
Volume weighted average price (VWAP): It is just a moving average but puts Volume into the calculation.
Point of control (POC): It is the price level at which the greatest number of contracts are traded during a given trading period.
Relative strength index (RSI): It compares a security’s strength on days when prices go up to its strength on days when prices go down.
Moving Average Convergence Divergence: It is a trend-following momemtum indicator that shows the relationship between two EMAs of a security's price. The MACD line is calculated by subtracting the 26-period EMA from the 12-period EMA.
High Volume Node (HVN): It refers to the price at which the largest amount of volume occurred.
Disclaimer: The opinions in this article are the author’s and do not necessarily represent the views of Mettis Link News (MLN).
Copyright Mettis Link News
Posted on:2023-07-23T18:47:47+05:00
39349

