

July 30, 2023 (MLN): The following is an outlook for the KSE-100 index and some strong scrips based on technical analysis (historical quantitative data).
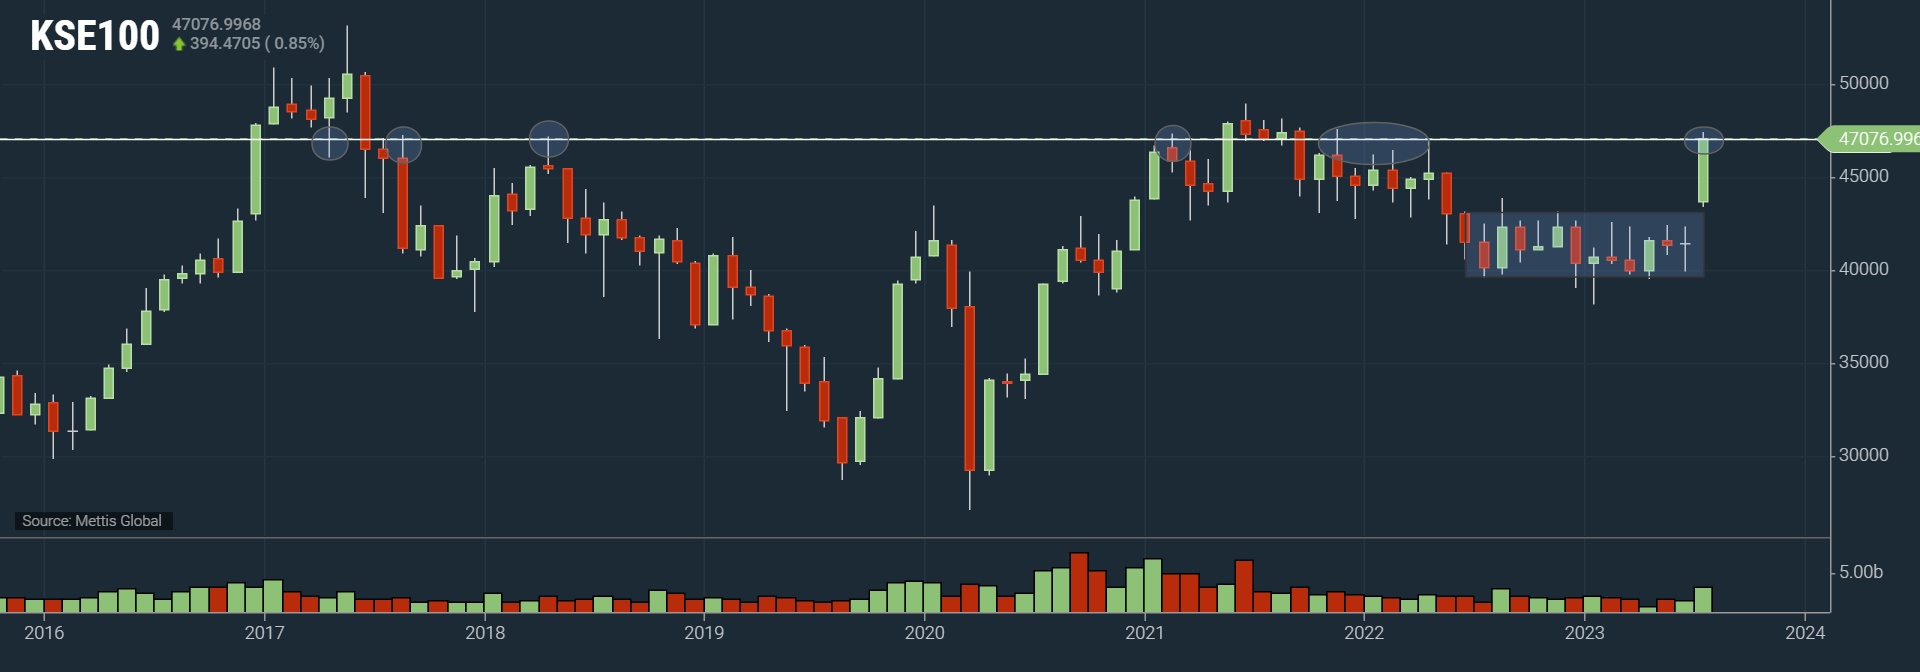
KSE-100 Monthly time-frame chart
| Support Levels | ||
|---|---|---|
| 46,000 | 45,400 | 44,300 |
| S1 | S2 | S3 |
| Resistance Levels | ||
|---|---|---|
| 47,100 | 47,300 | 47,958 |
| R1 | R2 | R3 |
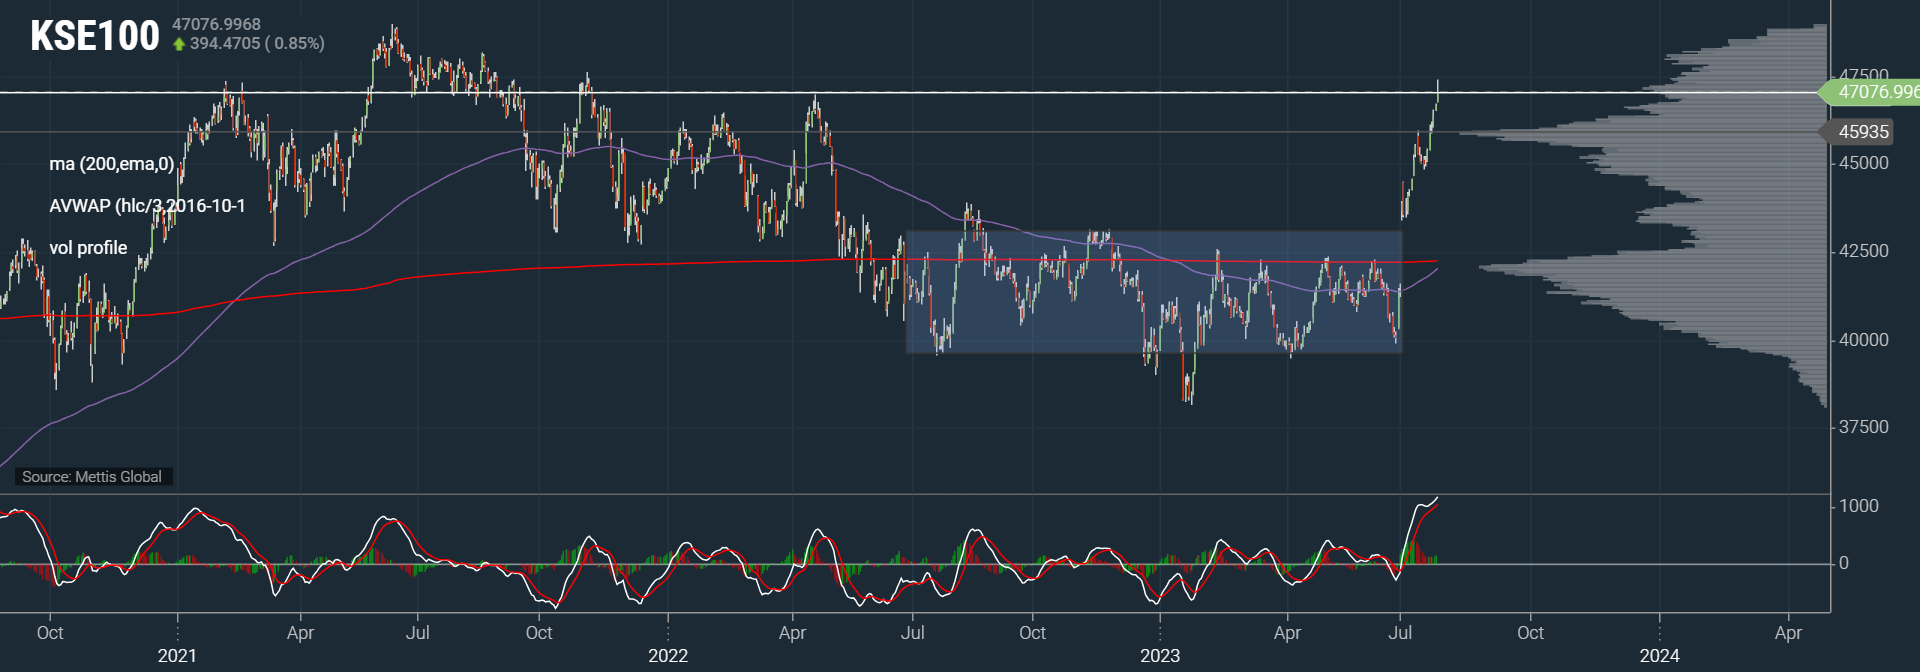
The benchmark KSE-100 Index closed Friday's trading session at 47,077 points, gaining 1,156pts or 2.45% WoW, breaching the 47,000pts mark after 21 months.
The KSE-100 index has gained 5,624pts or 13.57% since the Staff Level Agreement (SLA) was signed with the International Monetary Fund (IMF) on June 30.
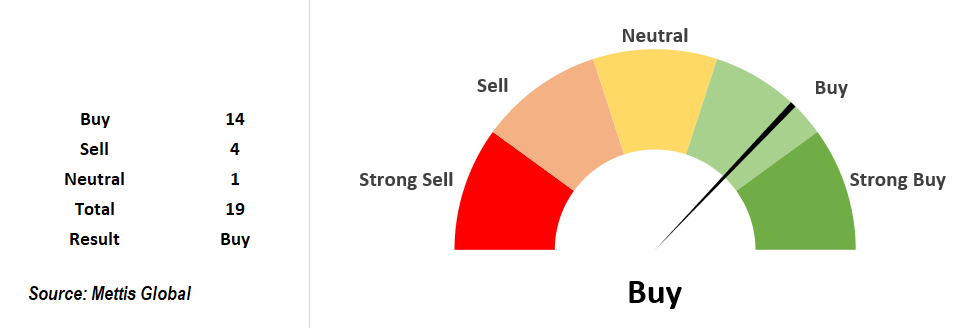
Based purely on technicals, the current stance is still "buy," although there are some warning signals triggering across some indicators.
The 47,000 point level holds significant historical importance, as evident from the chart above.
From a technical perspective, it is likely that the market may take a breather and experience a correction.
However, despite this potential correction, the overall uptrend is expected to remain intact.
| Recommended Scrips Outperformed KSE-100 | |||
|---|---|---|---|
| Scrips | Buy Price | Last Price | Return |
| SEARL | 47.6 | 46.32 | -2.69% |
| PSO | 121.64 | 131 | 7.69% |
| HCAR | 124.27 | 135.66 | 9.17% |
| OGDC | 88.1 | 91.67 | 4.17% |
| WTL | 1.29 | 1.39 | 7.75% |
| Average Return | 5.2% | ||
| KSE-100 Return | 4.46% | ||
Strong Scrips to keep an eye on during correction
| Ticker | Close Price | Support zone | Upside target | Short-term trend | Longterm trend | MA Stance | Oscillator Stance | |
| Short-term | Long-term | |||||||
| MCB | 146.92 | 130-137 | 155 | 200 | Up | Down | Buy | Sell |
| PSO | 131 | 126 | 154 | 200 | Up | Down | Buy | Buy |
| HCAR | 135.66 | 129 | 136 (Achieved) | 165 | Up | Down | Buy | Sell |
| OGDC | 91.67 | 88.25 | 99 | 125 | Up | Down | Strong Buy | Buy |
| WTL | 1.39 | 1.35 | 1.6 | 1.95 | Neutral | Down | Strong Buy | Buy |
Price per share (Rs)
| Unusual Volume (in PKR) | |||
|---|---|---|---|
| Ticker | MTD Average | 52 week Average | Volume Change |
| MCB | 188,821,422 | 58,122,327 | 3.25x |
| PSO | 381,581,873 | 156,583,036 | 2.44x |
| HCAR | 85,056,629 | 23,521,705 | 3.62x |
| OGDC | 693,266,187 | 340,161,137 | 2.04x |
Month-to-date (MTD)
The KSE-100 is currently a hot topic of discussion, just two months ago, I had written here how a break of the 12-month long range is highly likely, and will lead to a substantial expansion.
Since the IMF deal on June 30, the KSE-100 index has experienced a remarkable ~14% gain, surpassing every resistance level and showing no signs of slowing down.
Now, the question arises: how sustainable is this rally? Could it mark the beginning of a new bull run, leading to a new all-time high, as suggested by experts, like Arif Habib Limited? Or is it merely a dead cat bounce, enticing retail investors at the top?
The sentiment among many investors seems to be mixed. Most have remained on the sidelines throughout the rally, missing out on the gains.
Others, despite the sharp rally, find themselves with investments at such high prices that they are not even at breakeven levels.
Furthermore, there are those who invested in certain stocks that remained stagnant during the entire rally.
In general, it appears that most retail investors did not benefit significantly from this upward movement.
Based purely on technicals, the current stance is still "buy," although there are some warning signals triggering across some indicators.
The daily RSI for KSE-100 is currently 82, which is usually considered an overbought territory.
However, it is worth noting that during times of strong trending market conditions, RSI can stay in overbought territory for long periods of time.
For example, on December 20, 2016, the RSI peaked at 90.26, and the KSE index closed at 47,250. Over the next 4 months, the RSI went from 90 to 30, while the KSE remained in the range of 50,000-46,000, experiencing no major correction and a maximum drawdown of only 1,000 points, while staying greater than 47,250 for most of the time. The index then reached a peak of 53,000 in May 2017.
PSO
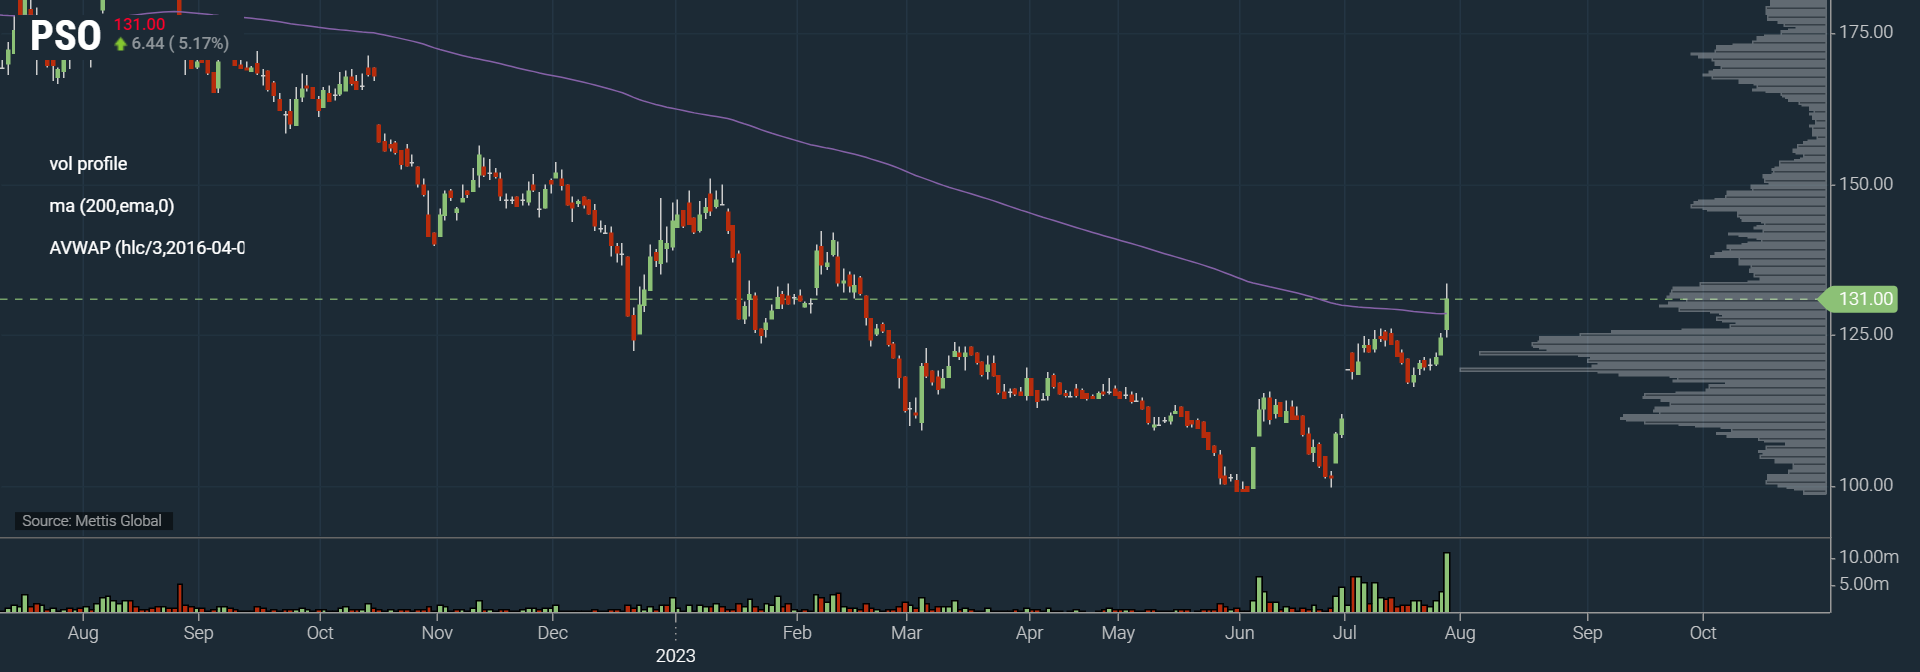
Daily time-frame chart
PSO is one of the large cap scrips that bounced off from its short-term support area, and gave another leg up, consequently breaking out of its range, as well as above its 1D 200EMA.
It appears to be a promising scrip to monitor closely during the next KSE-100 correction, keeping an eye out for potential entry opportunities around the support zone.
HCAR
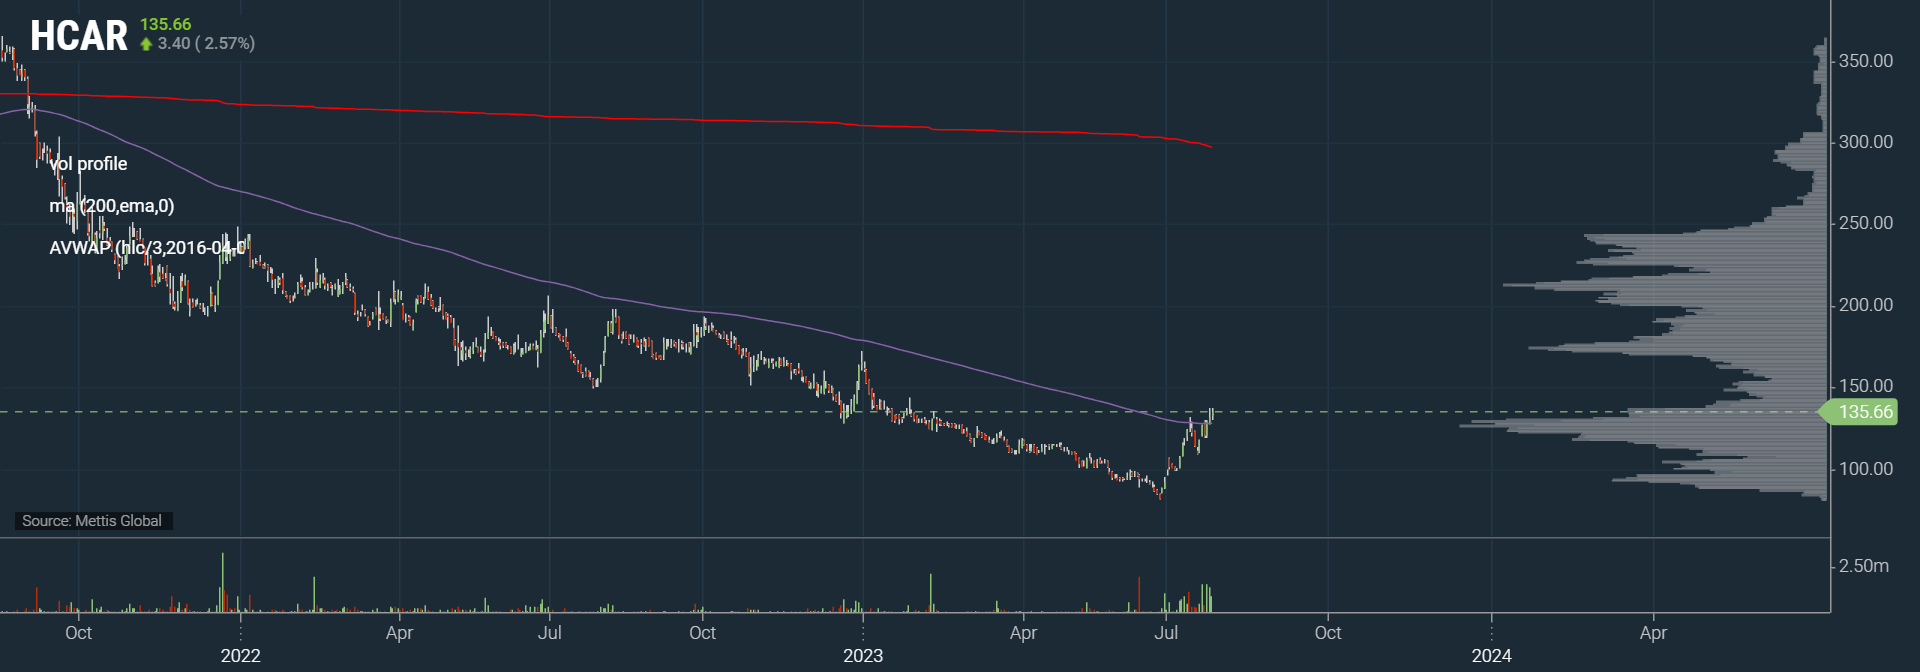
Daily time-frame chart
HCAR broke out above 1D 200EMA level for the first time since since September of 2021. HVN is around Rs175, whereas VWAP is way above this price.
Technically, this breakout appears promising for a lot of upside, but it has already achieved our short-term target.
Therefore, caution is advised, and it may be prudent to consider entering new positions around the support zone
With volumes picking up, there is a chance for some mean reversion, although trading near HVN or VWAP might be less likely.
OGDC
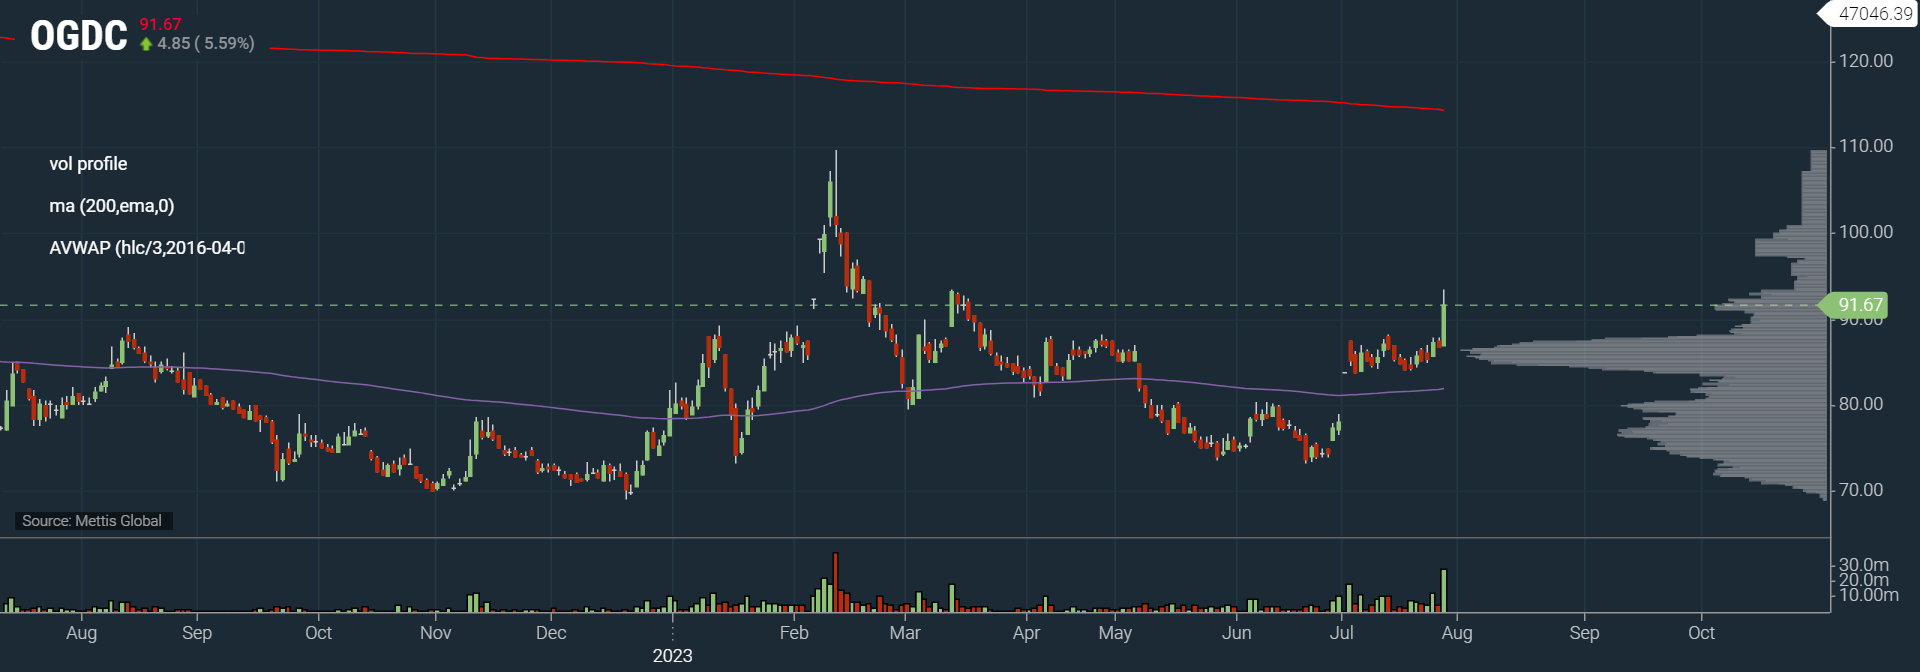
Weekly time-frame chart
OGDC has broken out of its range high of Rs88, currently trading with a daily RSI of 72.69 and above the 1D 200EMA.
It is advisable to consider entering new positions only if there is evidence of strength around its support zone at Rs88, with target remaining at mean reversion around Rs100.
KSE-100 Daily time-frame chart
Technical terms used:
Dead cat bounce: A dead cat bounce is a temporary, short-lived recovery of asset prices from a prolonged decline or a bear market that is followed by the continuation of the downtrend.
Moving average (MA): A calculation that takes the arithmetic mean of a given set of prices over a specific number of days in the past.
Exponential moving average (EMA): A weighted average that gives greater importance to the price of a stock in more recent days, making it an indicator that is more responsive to new information.
Hull Moving Average (HMA): It measures the average price of an asset over a period of time.
Volume weighted average price (VWAP): It is just a moving average but puts Volume into the calculation.
Point of control (POC): It is the price level at which the greatest number of contracts are traded during a given trading period.
Relative strength index (RSI): It compares a security’s strength on days when prices go up to its strength on days when prices go down.
Moving Average Convergence Divergence: It is a trend-following momemtum indicator that shows the relationship between two EMAs of a security's price. The MACD line is calculated by subtracting the 26-period EMA from the 12-period EMA.
High Volume Node (HVN): It refers to the price at which the largest amount of volume occurred.
Disclaimer: The opinions in this article are the author’s and do not necessarily represent the views of Mettis Link News (MLN).
Copyright Mettis Link News
Posted on:2023-07-30T16:45:39+05:00
39474

