

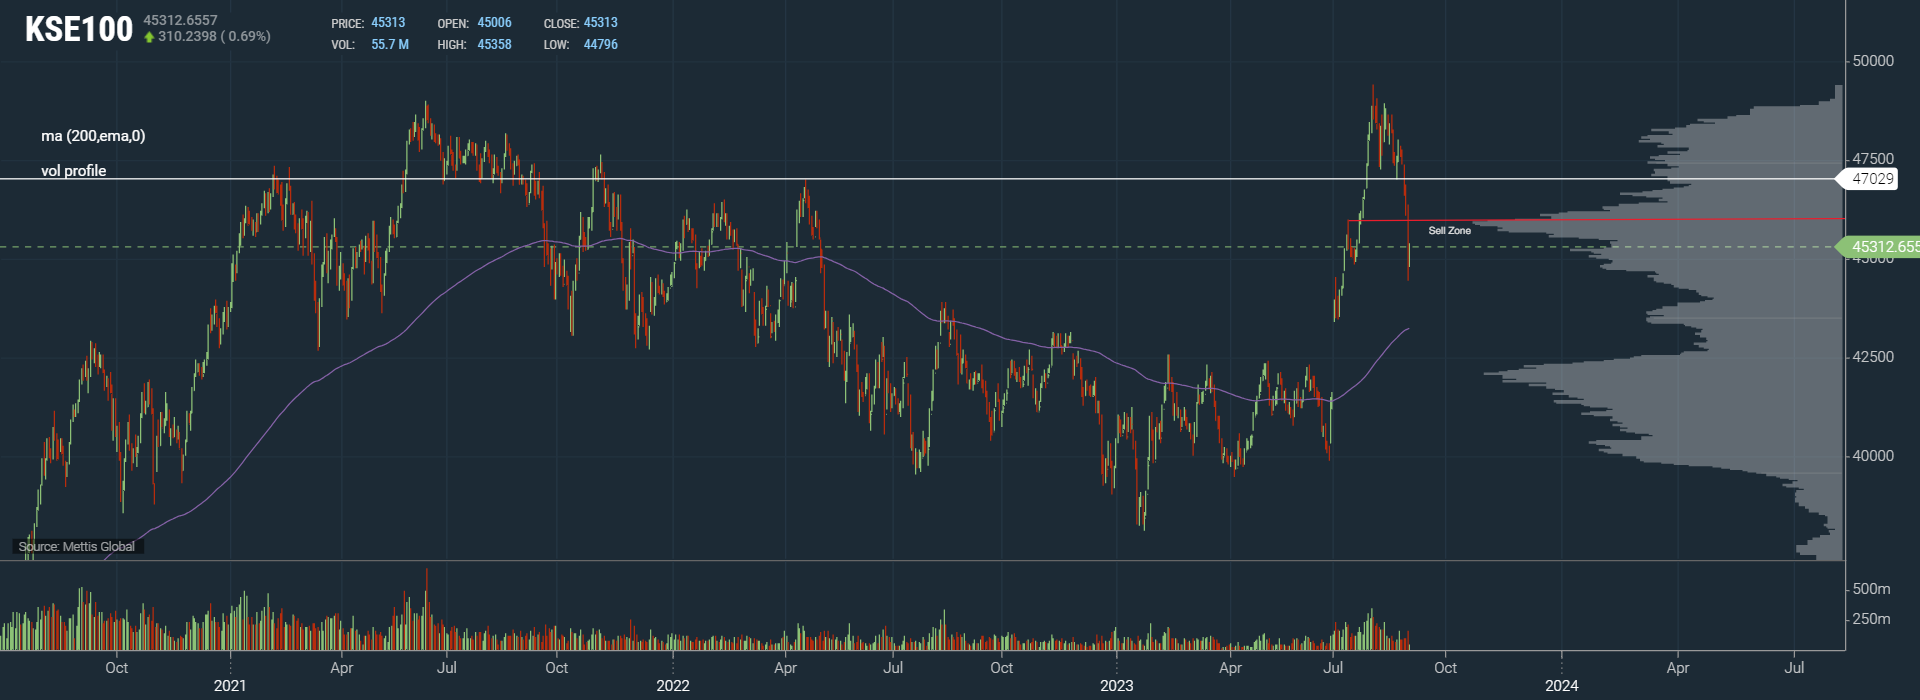
September 03, 2023 (MLN): Failure to hold the 47,000 level was a significant warning sign, and the market is expected to consolidate in the near term with a possible pullback towards 46,000. However, the 43,500 level remains a potential target if the bearish trend continues. Caution and prudent decision-making are crucial in these uncertain market conditions.
KSE-100 Daily time-frame chart
| Support Levels | ||
|---|---|---|
| 44,200 | 43,800 | 43,500 |
| S1 | S2 | S3 |
| Resistance Levels | ||
|---|---|---|
| 46,000 | 47,000 | 49,000 |
| R1 | R2 | R3 |
Recommendation Summary
The KSE-100 Index faced a critical juncture when it failed to maintain the crucial 47,000 support level, which has been emphasized as a pivotal point time and time again. The inability to hold this level acted as a clear signal to exit all long positions. Subsequently, the market witnessed a sharp sell-off.
KSE-100 fell as low as 44,500 before recovering to the current level of 45,300.
Looking ahead, it is likely that the market will consolidate or remain sidelined in the upcoming week. A pullback towards the 46,000 level could be in sight as the market attempts to find stability. Selling is recommended near that level.
On the flip side, it is important to note that the 43,500 level, remains a potential target if the current downward trend persists.
A more cautious approach is advisable for market participants. Monitoring price movements and exercising risk management strategies should remain a top priority.
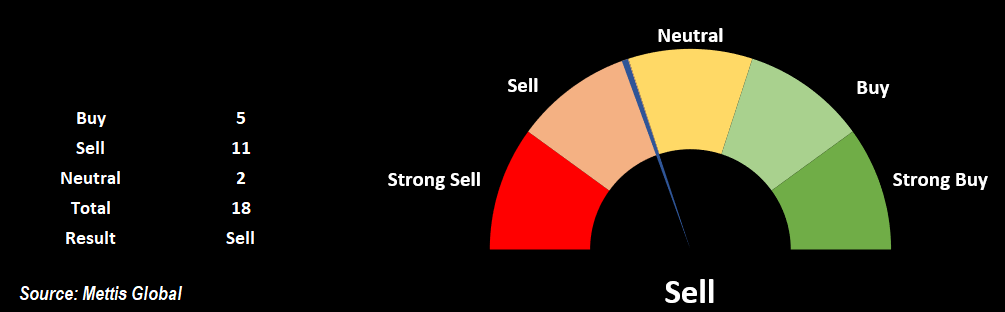
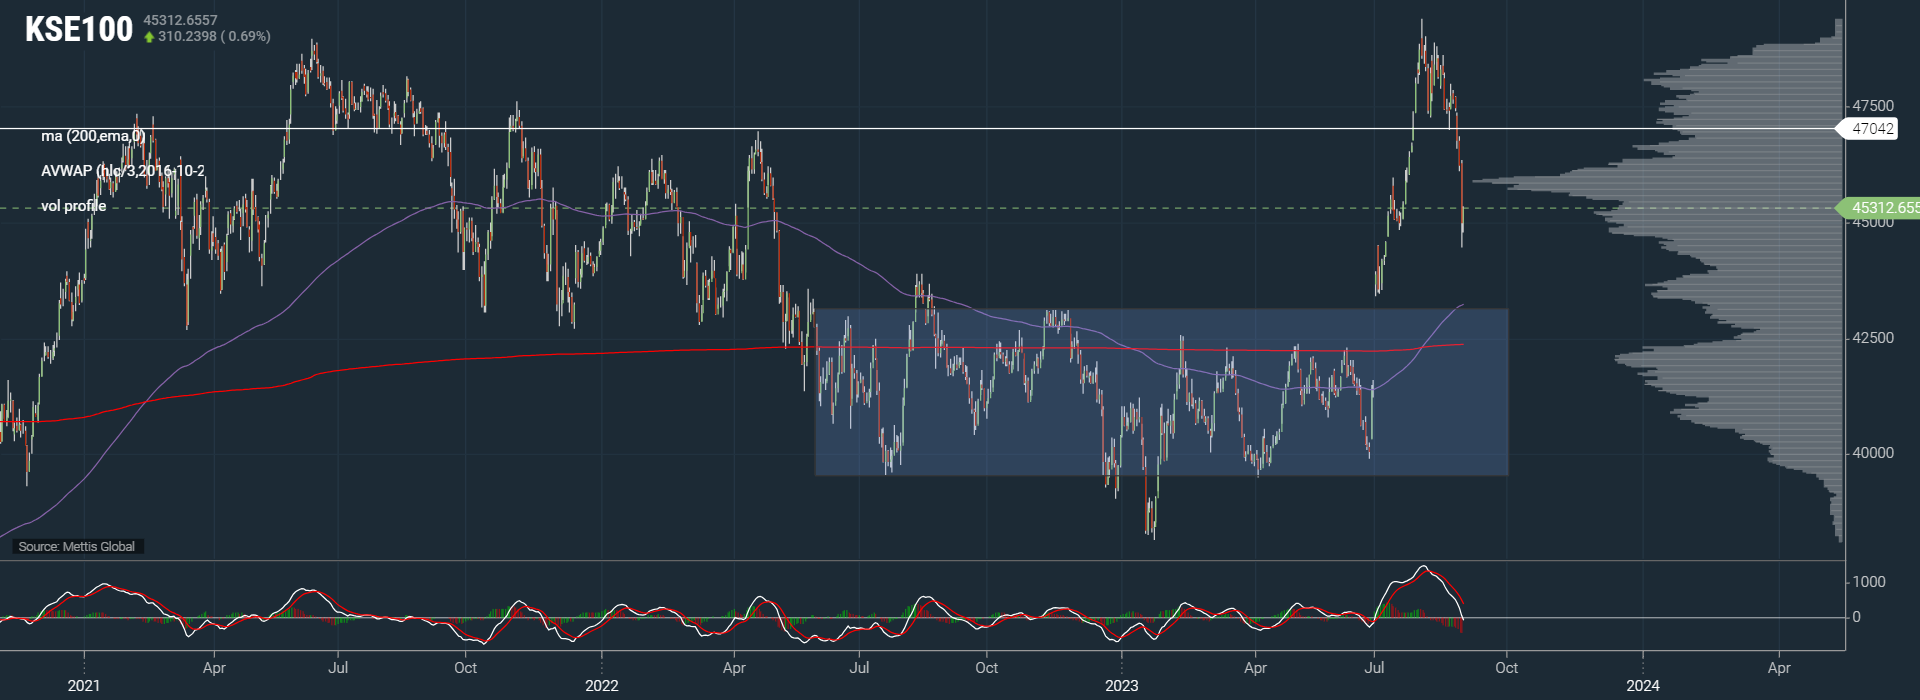
Based purely on technicals, the present position on the daily time-frame suggests a "Sell" stance, whereas on the weekly time-frame, it indicates a "Buy" position.
Scrips to Monitor
| Ticker | Close Price | Buy zone | Sell zone | Target | Short-term trend | Longterm trend | MA Stance | Oscillator Stance | |
| Take-Profit | Stop-Loss | ||||||||
| SHEL | 132.7 | – | 137.5 | 128 | 140.23 | Down | Down | Sell | Neutral |
| ENGRO | 246.14 | – | 251.25 | 243 | 255 | Down | Down | Strong Sell | Neutral |
| OGDC | 94.46 | 90.8 | – | 96 | 88 | Neutral | Down | Sell | Neutral |
| TELE | 6.55 | – | 6.7 | 5.85 | 7.05 | Down | Down | Strong Sell | Neutral |
Price per share (Rs)
KSE-100 Daily time-frame chart
Disclaimer: The opinions in this article are the author’s and do not necessarily represent the views of Mettis Link News (MLN). Nothing in this article should be considered the sole basis for making financial decisions.
Copyright Mettis Link News
Posted on:2023-09-03T21:55:48+05:00
40154

