

September 06, 2023 (MLN): The cement sector has shown a strong bullish momentum since May of this year, when it crossed above the one-day 200 exponential moving average (1D 200EMA) for the first time in eight months.
The 1D 200EMA is a key indicator of the long-term trend and the cement sector had been trading below it since September 2022.
However, the recent rally has brought the cement sector index to a critical juncture, as it is now retesting the 1D 200EMA from above for the first time this year.
The 1D 200EMA is currently at 39,800, while the cement sector index is hovering around 40,500. This level is of great significance, as it will determine whether the bullish trend will continue or not.
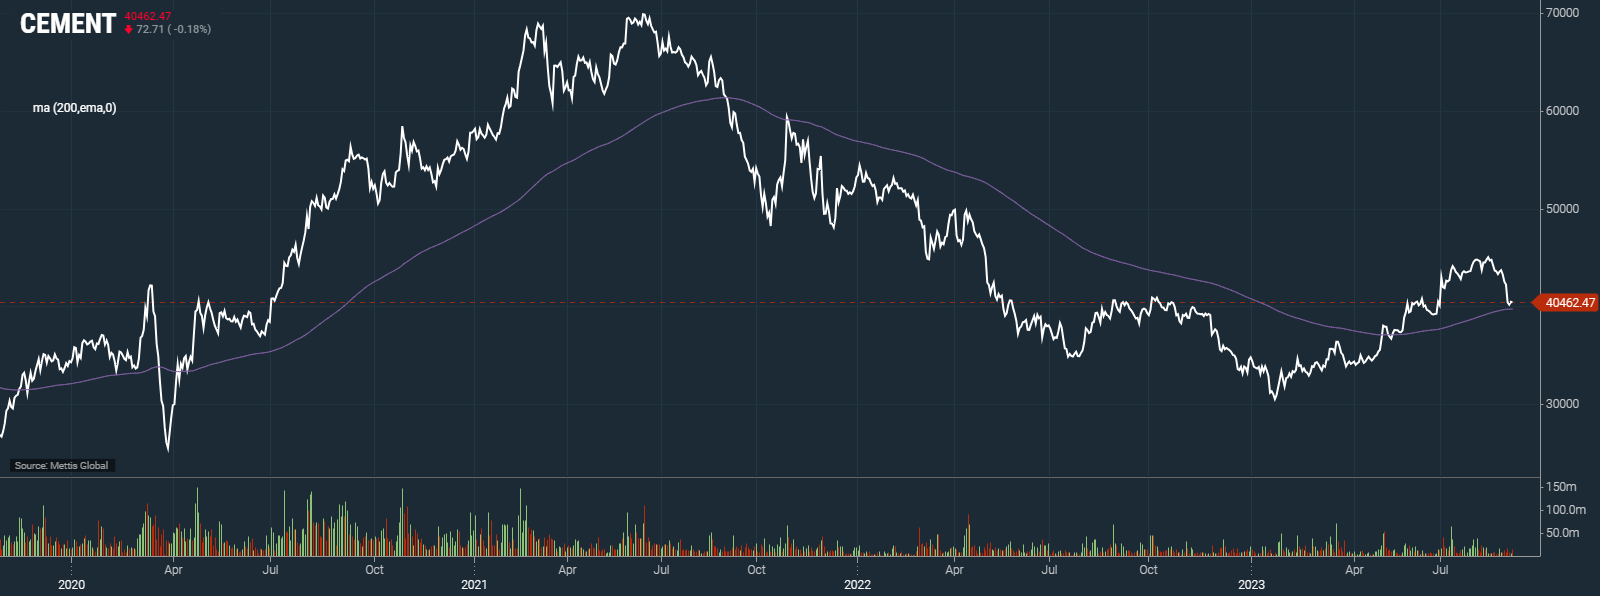
If the cement sector index can hold above the 1D 200EMA, it will confirm the uptrend continuation and open up more room for upside potential.
On the flip side, if the cement sector index falls below the 1D 200EMA, it will signal a loss of momentum and a possible return to the bearish scenario.
Therefore, a cautious approach is advisable for market participants. Monitoring price movements and exercising risk management strategies should remain a top priority.
Cement Sector Companies' Stock Performance
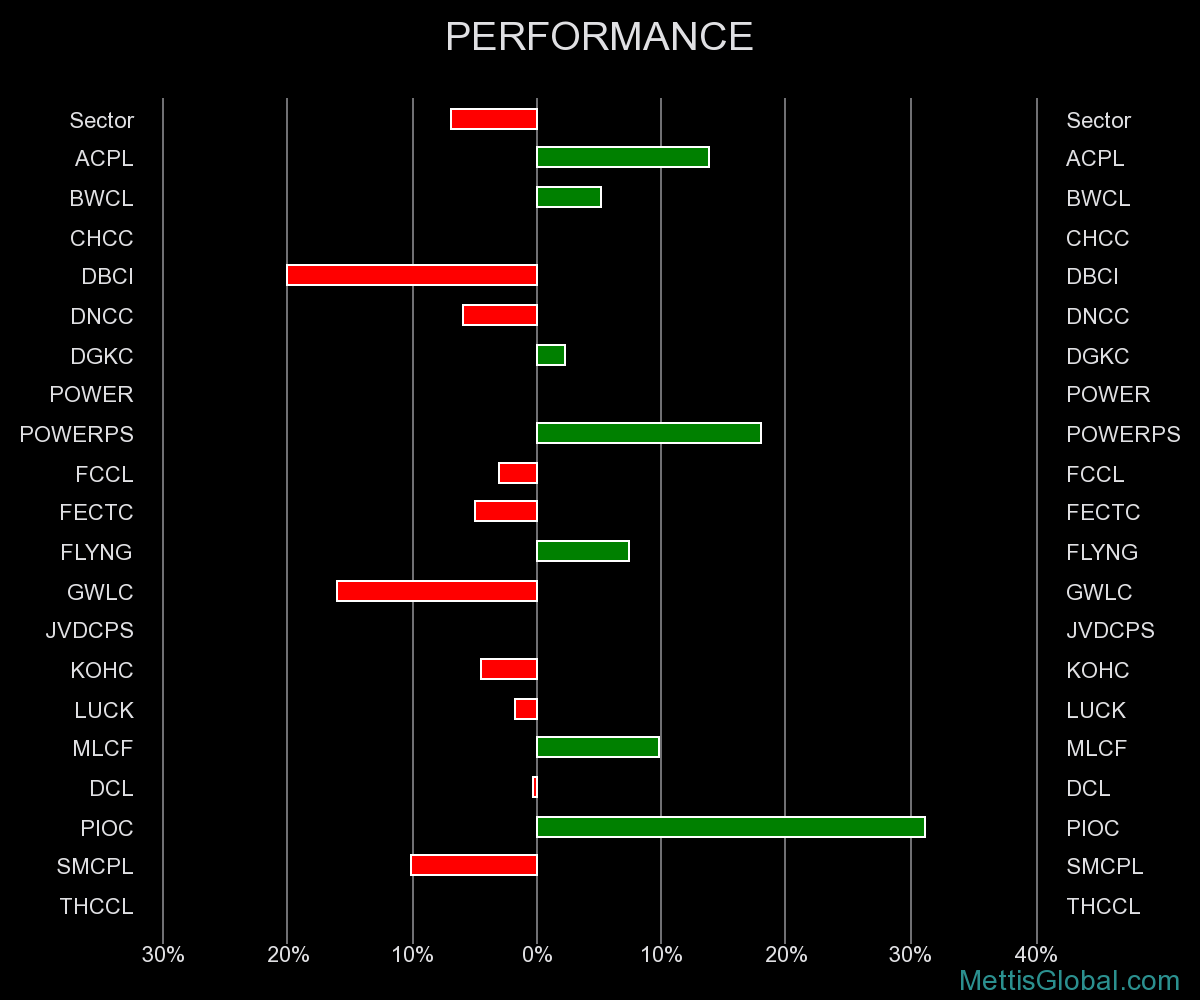
30-Day
Scrip Price Movements
| Symbol | Sep-23 | Jun-23 | Dec-22 | FYTD | CYTD |
|---|---|---|---|---|---|
| ACPL | 81.99 | 82.87 | 56.55 | -1.06% | 44.99% |
| BWCL | 150 | 145 | 128.01 | 3.45% | 17.18% |
| CHCC | 124.55 | 120.28 | 101.9 | 3.55% | 22.23% |
| DBCI | 3.12 | 3.12 | 3.12 | 0.00% | 0.00% |
| DNCC | 10.1 | 10.3 | 7 | -1.94% | 44.29% |
| DGKC | 43.8 | 51.3 | 51.64 | -14.62% | -15.18% |
| POWER | 3.65 | 4.1 | 4.62 | -10.98% | -21.00% |
| FCCL | 10.91 | 11.76 | 12.02 | -7.23% | -9.23% |
| FECTC | 19.5 | 19.99 | 17.53 | -2.45% | 11.24% |
| FLYNG | 5.52 | 5.54 | 5.86 | -0.36% | -5.80% |
| GWLC | 16.2 | 15.5 | 15.99 | 4.52% | 1.31% |
| KOHC | 156.99 | 173.47 | 147.7 | -9.50% | 6.29% |
| LUCK | 553 | 522.09 | 446.58 | 5.92% | 23.83% |
| MLCF | 28.55 | 28.33 | 22.57 | 0.78% | 26.50% |
| DCL | 4.06 | 4.15 | 4.53 | -2.17% | -10.38% |
| PIOC | 82.9 | 86.63 | 51.43 | -4.31% | 61.19% |
| SMCPL | 13.26 | 17.31 | 14.5 | -23.40% | -8.55% |
| THCCL | 12.2 | 11.36 | 11.92 | 7.39% | 2.35% |
| Sector Index | 40,462 | 40,175 | 34,839 | 0.72% | 16.14% |
Stock Close/Current Price
Volume Comparison
| Average Volume | |||
|---|---|---|---|
| Symbol | Since SBA (Jul-Current) | Jan-Jun | % Change |
| ACPL | 45,396 | 112,794 | -59.75% |
| BWCL | 16,040 | 20,364 | -21.23% |
| CHCC | 530,938 | 506,779 | 4.77% |
| DBCI | – | – | – |
| DCL | 976,222 | 719,215 | 35.73% |
| DGKC | 2,509,441 | 2,437,506 | 2.95% |
| DNCC | 5,411 | 14,545 | -62.80% |
| FCCL | 3,871,300 | 2,689,847 | 43.92% |
| FECTC | 5,400 | 10,628 | -49.19% |
| FLYNG | 1,070,367 | 667,252 | 60.41% |
| GWLC | 136,300 | 51,822 | 163.01% |
| KOHC | 136,365 | 130,989 | 4.10% |
| LUCK | 511,619 | 430,145 | 18.94% |
| MLCF | 5,208,955 | 5,009,907 | 3.97% |
| PIOC | 808,362 | 1,672,198 | -51.66% |
| POWER | 585,344 | 401,074 | 45.94% |
| SMCPL | 12,700 | 3,062 | 314.76% |
| THCCL | 262,000 | 202,376 | 29.46% |
| Sector Index | 927,342 | 838,576 | 10.59% |
Volume in Shares
Cement Sector vs KSE-100

Disclaimer: The views and analysis in this article are the opinions of the author and are for informational purposes only. It is not intended to be financial or investment advice and should not be the basis for making financial decisions.
Copyright Mettis Link News
Posted on:2023-09-06T13:23:33+05:00
40216

